Guide/Anatomy of a miniscope recording
This guide explains what you are actually looking at in a raw one-photon (1p) Miniscope recordings, and what causes each feature: the haze, the soft cells, the drift, the grain. None of it is a mistake. Each one comes from a real, understandable step between the calcium in a neuron and the numbers in your file, and knowing which step makes which feature tells you what to fix at the rig and what your analysis has to undo.
Every image below is simulated with Minisim, an open-source forward model that builds a recording from its physical parts: cells, optics, tissue, brain motion, and the camera. Because the recording is built forward, the exact truth is known at every stage, which is what lets us show each effect on its own. The frames show a roughly 400 µm field of view of cytosolic GCaMP neurons, and are made to look like real data rather than idealized cartoons. See #Try it yourself to build one with the sliders.
It does not optically section
If you are used to two-photon imaging, the biggest surprise in 1p data is that it does not optically section. A two-photon microscope only excites fluorescence at its focal point, so out-of-focus cells stay dark. A Miniscope floods the whole tissue with excitation light and collects everything that comes back, so cells above and below your focal plane still dump light onto the sensor. Your in-focus cells end up sitting in a glow contributed by all the out-of-focus ones.

Depth and focus
Your scope is focused at one depth. How far a cell sits from that plane decides howblurred and how dim it appears, and ultimately whether you can recover it at all.

A cell near the focal plane is a tight, bright spot. A cell deeper in tissue is blurred wider and dramatically dimmer, because its light is scattered and absorbed on the way back out to the lens. Going deeper costs both focus and brightness, so deep cells fade fastest.

Two practical notes. The V4's focal surface is slightly bowl-shaped (there is no room for a field-flattening lens), so cells toward the corners go soft even at the right depth, which is why people keep their cells of interest near the center. And the only cells you will reliably recover are the ones bright and sharp enough to clear the noise floor at the sensor.
Background: neuropil and blood vessels
Your cells are not floating in black. The surrounding tissue also fluoresces, out of focus, adding a shifting haze usually called neuropil. Blood vessels sit in front of the tissue and block light, leaving darker lines. Both ride along with your signal and change over time.

Cross-talk, and why demixing matters
Now put the optics and the background together. Every cell's light is blurred, and the deeper ones spread widest, so neighboring cells overlap. A pixel sitting over one cell also collects light from its neighbors and from the neuropil. That mixing is cross-talk.

This is why you cannot simply draw an ROI around a cell, average its pixels, and call that the cell's trace: that trace is a blend of the cell, its neighbors, and the background. Recovering the true single-cell signals requires demixing, which is what CNMF-style methods do, modeling the movie as a sum of spatial footprints and their time courses and solving for both at once. For 1p Miniscope data, where blur and scatter make overlap severe, demixing is essential rather than optional. See Minian for a Miniscope-focused pipeline built around this.
The brain will not hold still
The brain is not bolted to the skull. It pulses with the heartbeat and breathing and drifts as the animal moves, so the whole field of view jitters and drifts (very roughly ±10 µm). A fixed pixel does not stay on the same cell, and averaging over time smears every cell into a streak.

This is what motion correction (image registration) estimates and undoes. One thing to get right at the rig: locomotion carries a ~7 Hz stride rhythm, so sample well above it and keep exposures short, so the brain moves between frames (a shift you can measure and correct) rather than within a frame (motion blur baked into the pixels that no registration can remove).
Bright center, dim edges

The excitation light is brightest in the middle of the field in most miniscopes. This is because we don't always have the space needed to generate fully uniform, kholar illumination. Different miniscopes will have different amounts of uneven illumination. Coupled to this, the optics of most miniscopes collect less light toward the corners. This is call vignetting and is causes by steeper angled light rays, and those near the edges of the optics getting trimmed away on their way to the image sensor. So an identical cell looks brighter at the center than at the edge, and raw brightness is not a fair comparison across the field of view, something to keep in mind whenever you compare cells by intensity.
The sensor and the final image
Finally the camera turns light into numbers. A little stray excitation light adds a faint overall glow, and because only so many photons arrive per pixel, every pixel carries noise, the familiar grain in any real recording. Bright cells stand out of the noise; the faint, deep cells from earlier can disappear into it.
- What the camera actually records: a faint glow plus per-pixel noise.
-
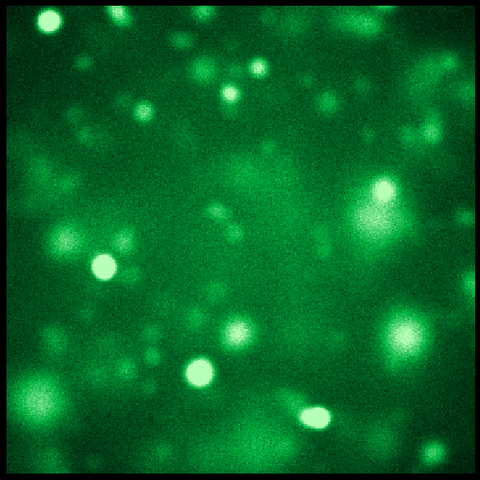 The final frame, shown in green
 -
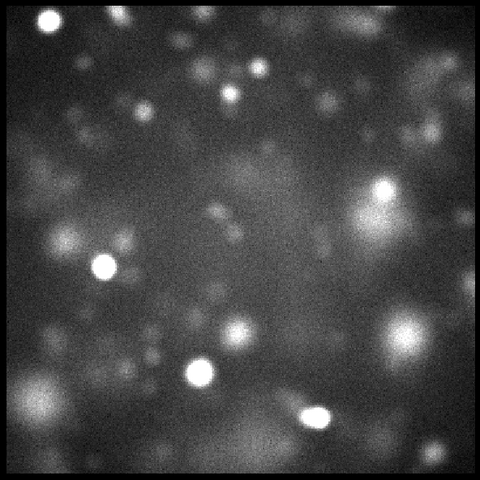 The same frame as raw grayscale counts


Putting it together
Every frame you record is this stack: your cells' signal, blurred and dimmed by depth, overlapping into cross-talk, sitting on neuropil and vessels, jittering with the brain, unevenly lit, and finally sampled with noise. Knowing which layer produces which feature tells you what to change at the scope (focus, expression depth, light power, frame rate, headbar stability) and what your analysis pipeline has to undo.
Try it yourself
These figures were generated with minisim, which builds a Miniscope recording forward from exactly these physical steps, so the true answer at every stage is known.
- Code and install: github.com/miniscope/minisim (
pip install "minisim[notebook]") - Interactive notebook: build the recording one stage at a time, with sliders for depth, light, motion, and noise: 01_anatomy.ipynb (after installing, run
minisim-notebooks copy 01_anatomy) - Documentation: minisim.readthedocs.io
See also Minian for analyzing recordings like these.