Difference between revisions of "Data Acquisition Software"
(→Download Software) |
m (Minor edits, credit to OpenCV package full name) |
||
| (15 intermediate revisions by 3 users not shown) | |||
| Line 1: | Line 1: | ||
[[File:OverviewDAQSoftware.png|thumb|600px]] | [[File:OverviewDAQSoftware.png|thumb|600px]] | ||
| − | The Data Acquisition (DAQ) Software developed for this project and provided through this wiki supports live streaming, syncing, and recording from up to two video sources. The software gives the user full control of camera properties (such as gain, exposure, frame rate) as well as controls the power of the excitation LED. Written in C++ using Microsoft Visual Studio, the software uses Open Computer | + | The Data Acquisition (DAQ) Software developed for this project and provided through this wiki supports live streaming, syncing, and recording from up to two video sources. The software gives the user full control of camera properties (such as gain, exposure, frame rate) as well as controls the power of the excitation LED. Written in C++ using Microsoft Visual Studio, the software uses the Open Source Computer Vision Library(OpenCV) to connect, control, and stream video data. |
| − | When a video source (microscope or behavioral camera) is connected, a new processing thread is created which constantly polls the video source for a new frame. If the video is being recorded to disk, an | + | When a video source (microscope or behavioral camera) is connected, a new processing thread is created which constantly polls the video source for a new frame. If the video is being recorded to disk, an additional thread is created which handles writing video data to disk without adding any overhead to the acquisition threads. While not fully implemented yet, the multithreaded nature of the software can support online image processing and real-time feedback without affecting data acquisition. |
[[File:DAQSoftware.png|center|600px]] | [[File:DAQSoftware.png|center|600px]] | ||
| Line 8: | Line 8: | ||
The data recorded by the DAQ software is saved in a folder structure based on the data and time of recording. | The data recorded by the DAQ software is saved in a folder structure based on the data and time of recording. | ||
| − | *Date/Time/ folder structure | + | *Data/Date/Time/ folder structure stored in the folder containing the DAQ Software executable file. |
**For example, 6_29_15/H15_M45_S12/ | **For example, 6_29_15/H15_M45_S12/ | ||
*‘settings_and_notes.dat’ records scope settings and notes | *‘settings_and_notes.dat’ records scope settings and notes | ||
| Line 28: | Line 28: | ||
[[File:DAQSoftwareThreads.png|center|600px]] | [[File:DAQSoftwareThreads.png|center|600px]] | ||
| + | |||
| + | The general work flow of using the DAQ software is shown below in red. Additional features are shown in blue. | ||
| + | |||
| + | [[File:DAQSoftwareFeatures.png|thumb|600px]] | ||
| + | #Select the Windows imaging device number associated with the Miniscope. This will be a number between 0 and 2 and will remain the same for each computer. Click 'Connect' and a new window should open up displaying the live video stream from the miniscope. If this window is red try clicking 'Connect' an additional time. | ||
| + | #Adjust the Exposure and Gain of the miniscope imaging sensor. For most appliations both of these should be set to their maximum. | ||
| + | #Set the excitation LED power. With the imaging sensor running at maximum exposure and gain the LED power should usually be somewhere between 1 and 10. Currently the LED power maxes out around 40% but can be increase if needed by adjusting a resistor on the CMOS imaging sensor PCB. If the 'Divide by 10' box is checked, the LED power is divided by 10. | ||
| + | #If using a behavioral camera, select the Windows imaging device number associated with it. Click 'Connect' and a new window should open displaying the live video stream. | ||
| + | #You can now drag click and hold you mouse over the behavioral camera window to select a Region Of Interest (ROI). Only pixels in the ROI will be saved. Properties supported by your behavioral camera can be adjusted by clicking 'Properties'. | ||
| + | #Enter the animal name. This information will be recorded in the Settings and notes.dat file. | ||
| + | #To record for a fixed amount of time enter it here. A '0' will run the recording until 'Stop' is clicked. | ||
| + | #Click 'Record'. | ||
| + | |||
| + | :A. If using a color CMOS imaging sensor, checking 'Color' will display the live video stream in color. Checking the individual color will display only those channels. | ||
| + | :B. Pixel values above the Saturation Threshold we be displayed as black. This give you an idea of if you are saturating the imaging sensor. This does not affect the data being saved, only the live stream display. | ||
| + | :C. The left 2 boxes show the current minimum and maximum pixel values. The right 2 boxes allow you to adjust black and white display levels. This does not affect the data being saved, only the live stream display. | ||
| + | :D. During recording you can submit notes here and they will be saved in the Setting and Notes.dat file along with a timestamp. | ||
| + | :E. Shows current number of frames recorded, Frames Per Second (FPS), write speed (this should be higher than the FPS). | ||
| + | :F. Once the Miniscope is connected, the 'Screen Shot' button will save the current frame of the Miniscope data steam to a .png. | ||
| + | :G. Text box that displays messages from the DAQ Software. | ||
<br clear=all> | <br clear=all> | ||
| Line 35: | Line 55: | ||
== Download Software == | == Download Software == | ||
| − | The current and previous versions of the DAQ Software can be downloaded [ | + | The current and previous versions of the DAQ Software can be downloaded [https://github.com/daharoni/Miniscope_DAQ_Software.git here]. |
== Source Code == | == Source Code == | ||
The GitHub repository for the DAQ software can be found [https://github.com/daharoni/Miniscope_DAQ_Software.git here]. The software is written in Microsoft Visual Studio using the Microsoft Foundation Class (MFC) and Open Computer Vision (OpenCV). | The GitHub repository for the DAQ software can be found [https://github.com/daharoni/Miniscope_DAQ_Software.git here]. The software is written in Microsoft Visual Studio using the Microsoft Foundation Class (MFC) and Open Computer Vision (OpenCV). | ||
Latest revision as of 17:09, 19 July 2017
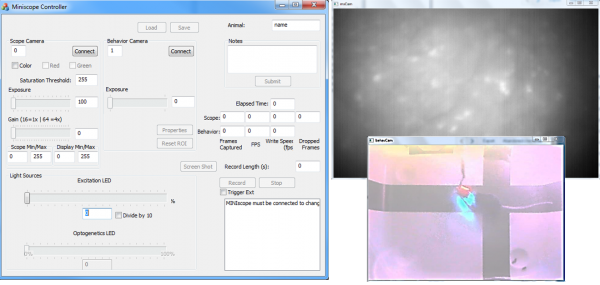
The Data Acquisition (DAQ) Software developed for this project and provided through this wiki supports live streaming, syncing, and recording from up to two video sources. The software gives the user full control of camera properties (such as gain, exposure, frame rate) as well as controls the power of the excitation LED. Written in C++ using Microsoft Visual Studio, the software uses the Open Source Computer Vision Library(OpenCV) to connect, control, and stream video data.
When a video source (microscope or behavioral camera) is connected, a new processing thread is created which constantly polls the video source for a new frame. If the video is being recorded to disk, an additional thread is created which handles writing video data to disk without adding any overhead to the acquisition threads. While not fully implemented yet, the multithreaded nature of the software can support online image processing and real-time feedback without affecting data acquisition.
Data Structure
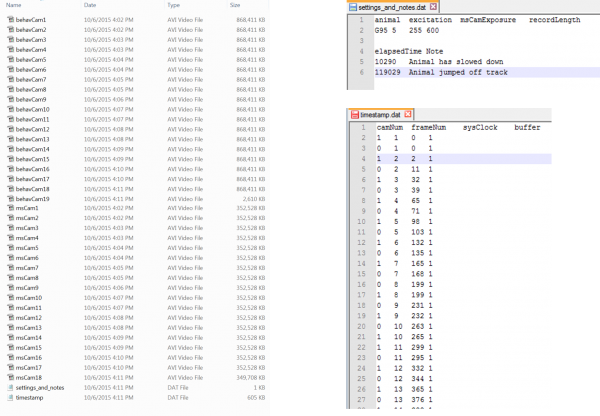
The data recorded by the DAQ software is saved in a folder structure based on the data and time of recording.
- Data/Date/Time/ folder structure stored in the folder containing the DAQ Software executable file.
- For example, 6_29_15/H15_M45_S12/
- ‘settings_and_notes.dat’ records scope settings and notes
- ‘timestamp.dat’ holds timing and syncing data for video streams
- ‘msCam1.avi’, ‘msCam2.avi’, etc. hold 1000 frames each of scope data
- ‘behavCam1.avi’, behavCam2.avi’, etc. hold 1000 frames each of behavior camera data
Features
- Live streaming/recording of microscope and behavioral camera video
- Syncing of video streams and external devices
- Controls exposure, gain, ROI, LED excitation power, frame rate
- Embedded note taking with time stamps
- Pixel saturation detection
- Supports color and monochrome imaging sensors
- Multithreaded software with dedicated thread for real-time feedback/processing
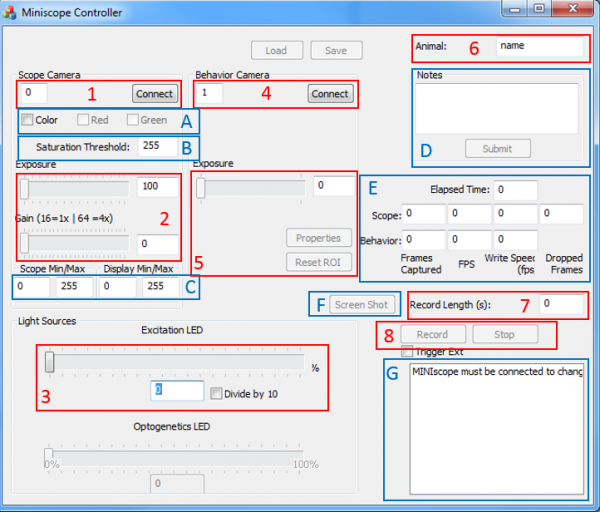
The general work flow of using the DAQ software is shown below in red. Additional features are shown in blue.
- Select the Windows imaging device number associated with the Miniscope. This will be a number between 0 and 2 and will remain the same for each computer. Click 'Connect' and a new window should open up displaying the live video stream from the miniscope. If this window is red try clicking 'Connect' an additional time.
- Adjust the Exposure and Gain of the miniscope imaging sensor. For most appliations both of these should be set to their maximum.
- Set the excitation LED power. With the imaging sensor running at maximum exposure and gain the LED power should usually be somewhere between 1 and 10. Currently the LED power maxes out around 40% but can be increase if needed by adjusting a resistor on the CMOS imaging sensor PCB. If the 'Divide by 10' box is checked, the LED power is divided by 10.
- If using a behavioral camera, select the Windows imaging device number associated with it. Click 'Connect' and a new window should open displaying the live video stream.
- You can now drag click and hold you mouse over the behavioral camera window to select a Region Of Interest (ROI). Only pixels in the ROI will be saved. Properties supported by your behavioral camera can be adjusted by clicking 'Properties'.
- Enter the animal name. This information will be recorded in the Settings and notes.dat file.
- To record for a fixed amount of time enter it here. A '0' will run the recording until 'Stop' is clicked.
- Click 'Record'.
- A. If using a color CMOS imaging sensor, checking 'Color' will display the live video stream in color. Checking the individual color will display only those channels.
- B. Pixel values above the Saturation Threshold we be displayed as black. This give you an idea of if you are saturating the imaging sensor. This does not affect the data being saved, only the live stream display.
- C. The left 2 boxes show the current minimum and maximum pixel values. The right 2 boxes allow you to adjust black and white display levels. This does not affect the data being saved, only the live stream display.
- D. During recording you can submit notes here and they will be saved in the Setting and Notes.dat file along with a timestamp.
- E. Shows current number of frames recorded, Frames Per Second (FPS), write speed (this should be higher than the FPS).
- F. Once the Miniscope is connected, the 'Screen Shot' button will save the current frame of the Miniscope data steam to a .png.
- G. Text box that displays messages from the DAQ Software.
Installation Guide
An installation guide can be found here.
Download Software
The current and previous versions of the DAQ Software can be downloaded here.
Source Code
The GitHub repository for the DAQ software can be found here. The software is written in Microsoft Visual Studio using the Microsoft Foundation Class (MFC) and Open Computer Vision (OpenCV).


